
Financial Highlights
Consolidated Statement
Profit and Loss Statement
(million yen)
| Year ending | Q1 June-Aug. |
Q2 June-Nov. |
Q3 June-Feb. |
Full year June-May |
|
|---|---|---|---|---|---|
| Net sales | May 2026 | 85,855 | 178,758 | 262,971 | 357,533 |
| May 2025 | 88,543 | 182,256 | 267,299 | 359,424 | |
| Operating income | May 2026 | △1,164 | 321 | 95 | 1,546 |
| May 2025 | 544 | 1,780 | 2,045 | 1,545 | |
| Ordinary income | May 2026 | △1,207 | 72 | △336 | 882 |
| May 2025 | 531 | 1,533 | 1,493 | 944 | |
| Current net income | May 2026 | △687 | △2,102 | △2,029 | △13,498 |
| May 2025 | 42 | 53 | △413 | △2,336 |
Balance Sheet
(million yen)
| Year ending | Q1 end | Q2 end | Q3 end | Year end | |
|---|---|---|---|---|---|
| Total assets | May 2026 | 298,866 | 306,316 | 308,967 | 305,992 |
| May 2025 | 294,055 | 297,809 | 297,004 | 300,454 | |
| Net assets | May 2026 | 95,388 | 96,259 | 100,121 | 94,241 |
| May 2025 | 99,952 | 98,878 | 99,970 | 94,804 |
Cash Flow
(million yen)
| Year ending | Q1 June-Aug. |
Q2 June-Nov. |
Q3 June-Feb. |
Full year June-May |
|
|---|---|---|---|---|---|
| Cash flow from sales | May 2026 | - | 3,940 | - | 5,404 |
| May 2025 | - | 1,111 | - | 3,216 | |
| Cash flow from investments | May 2026 | - | △8,897 | - | △6,042 |
| May 2025 | - | △7,778 | - | △14,334 | |
| Cash flow from financing | May 2026 | - | 9,074 | - | 7,462 |
| May 2025 | - | 3,695 | - | 7,470 |
Management Indicators
| Year ending | Q1 end | Q2 end | Q3 end | Year end | |
|---|---|---|---|---|---|
| Capital adequacy ratio (%) | May 2026 | 30.7 | 30.2 | 31.2 | 29.6 |
| May 2025 | 32.9 | 32.1 | 32.5 | 30.4 | |
| Net income per share (yen) | May 2026 | △21.95 | △67.10 | △64.77 | △430.74 |
| May 2025 | 1.37 | 1.69 | △13.20 | △74.54 |
Five-Year Summary
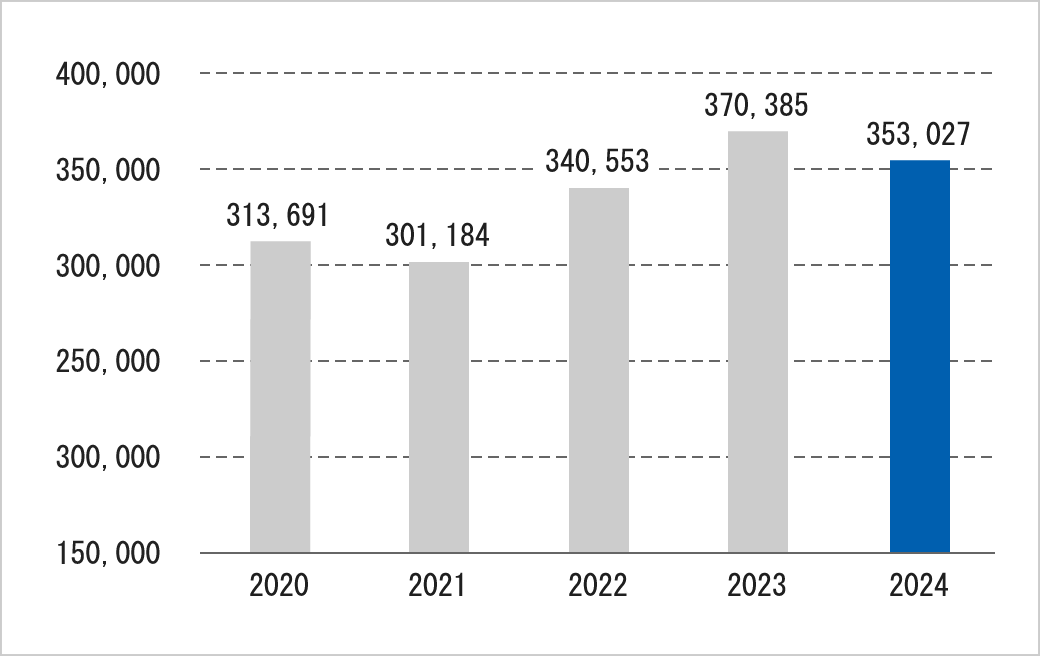
Net sales
(million yen)
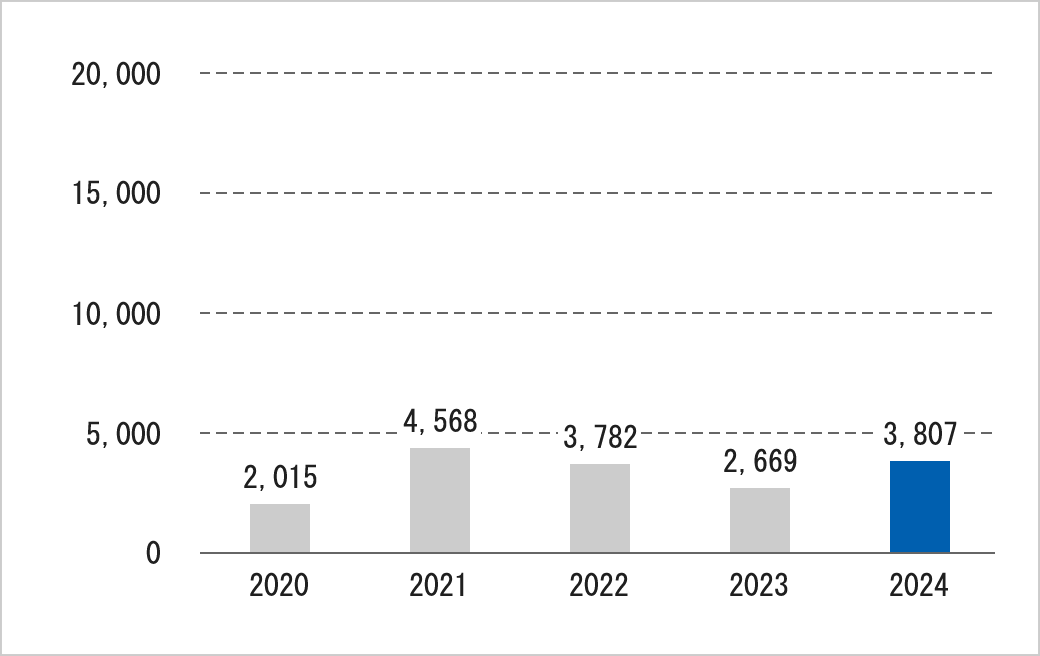
Operating income
(million yen)
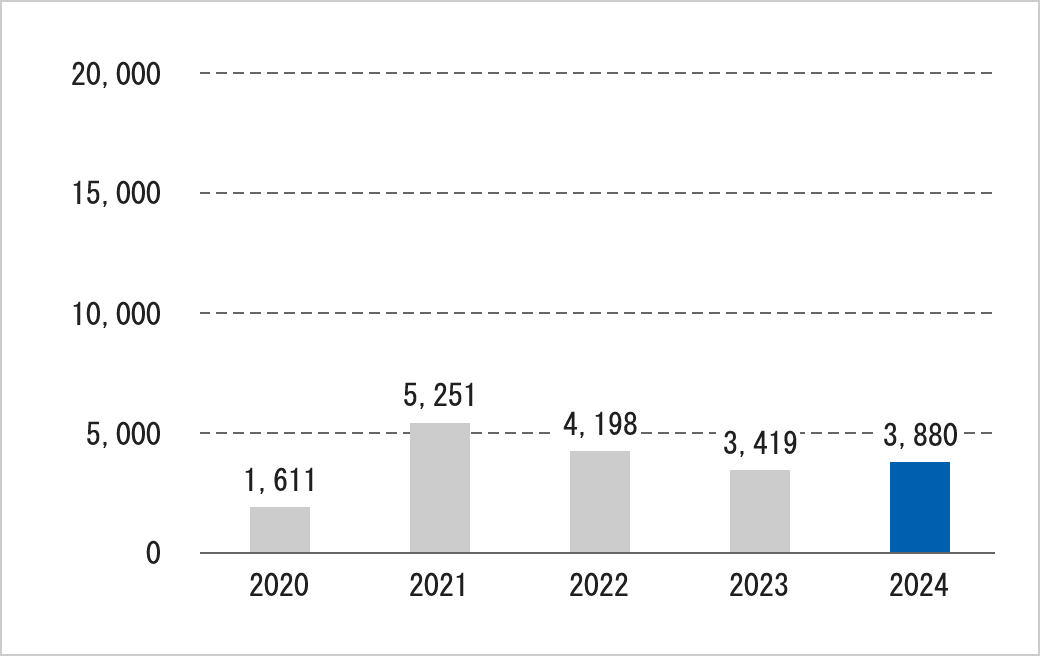
Ordinary income
(million yen)
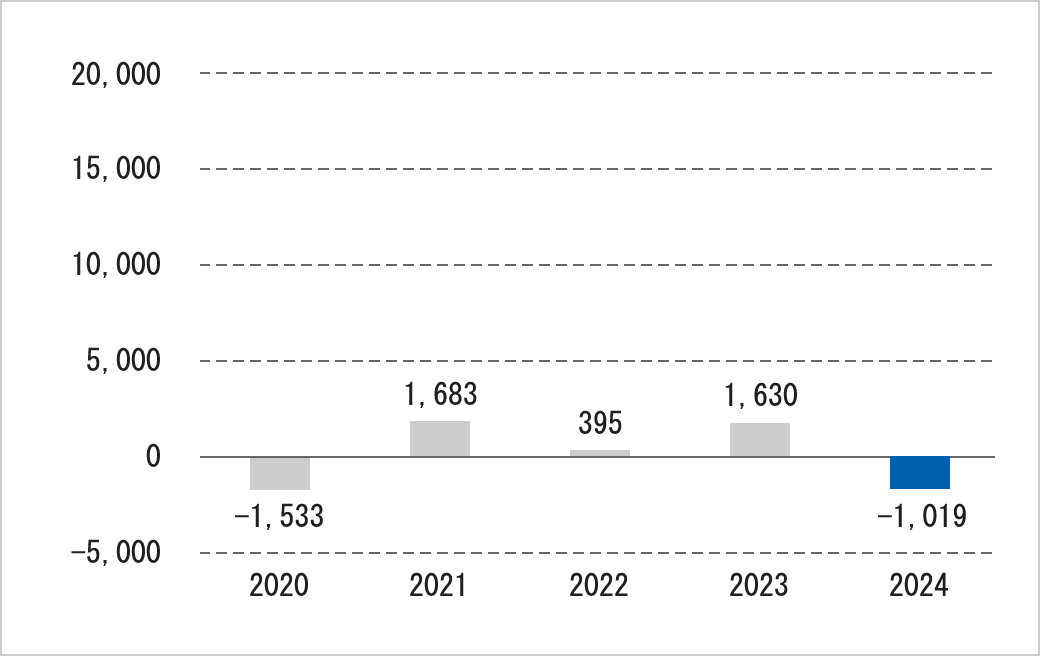
Current net income
(million yen)
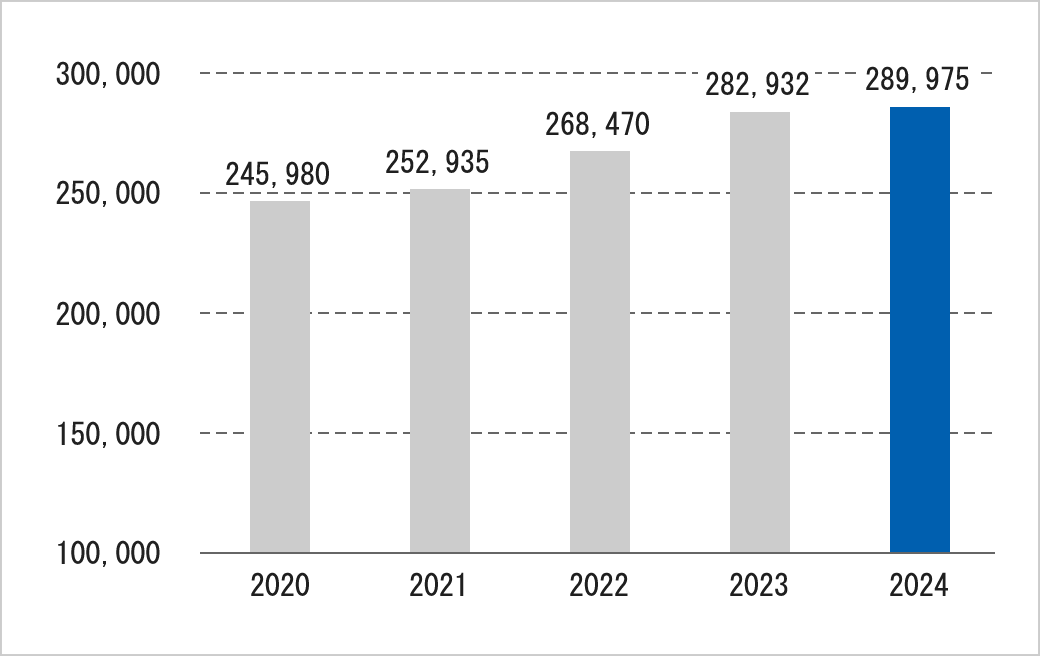
Total assets
(million yen)
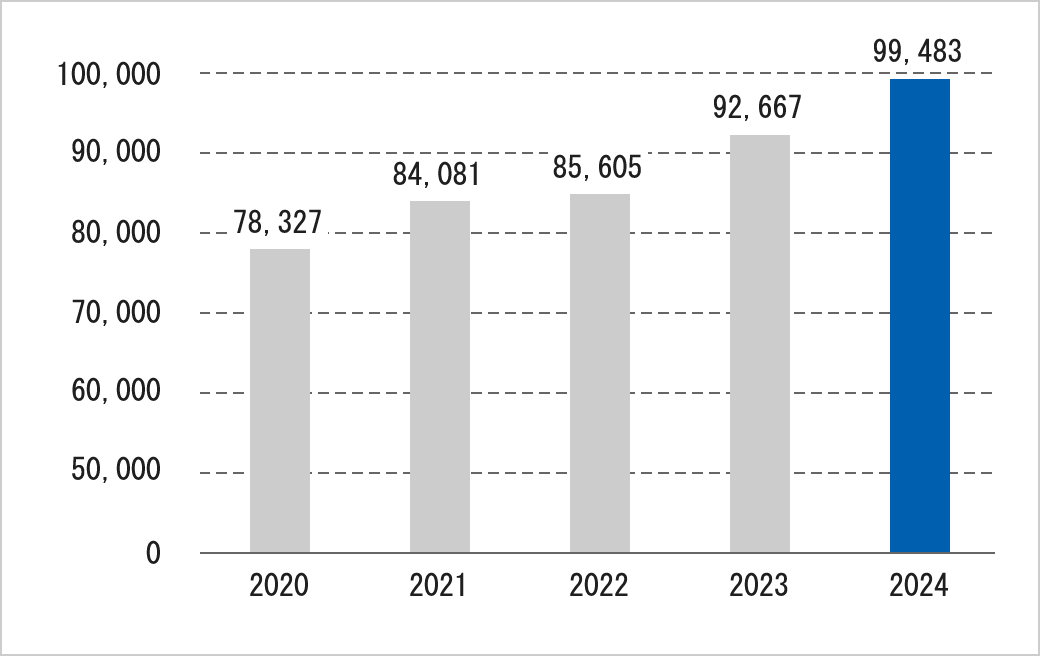
Net assets
(million yen)
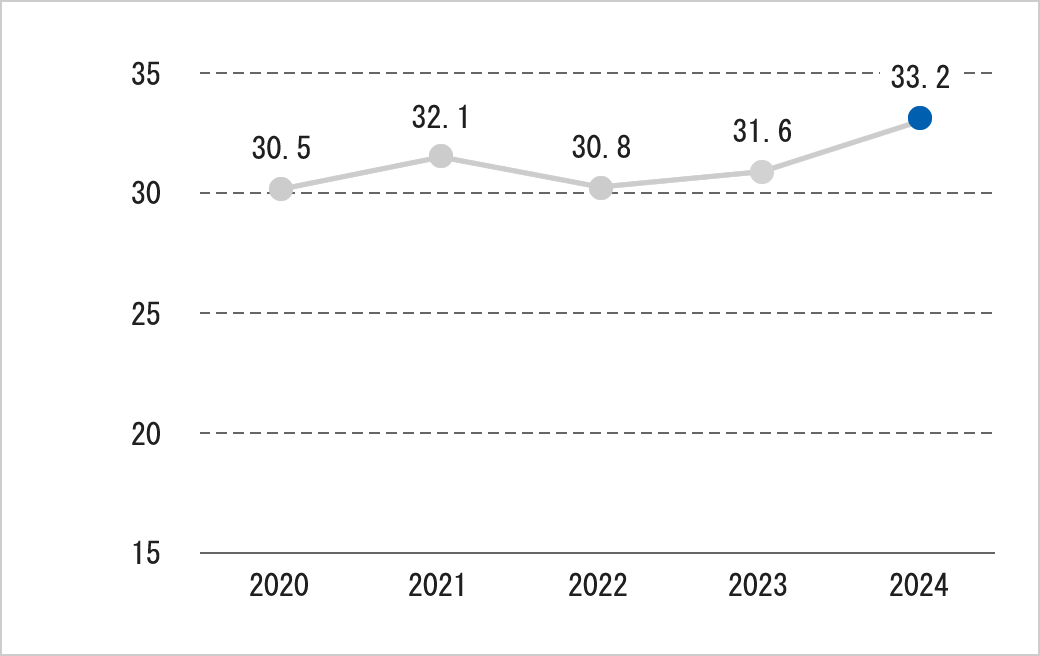
Capital adequacy ratio
(%)
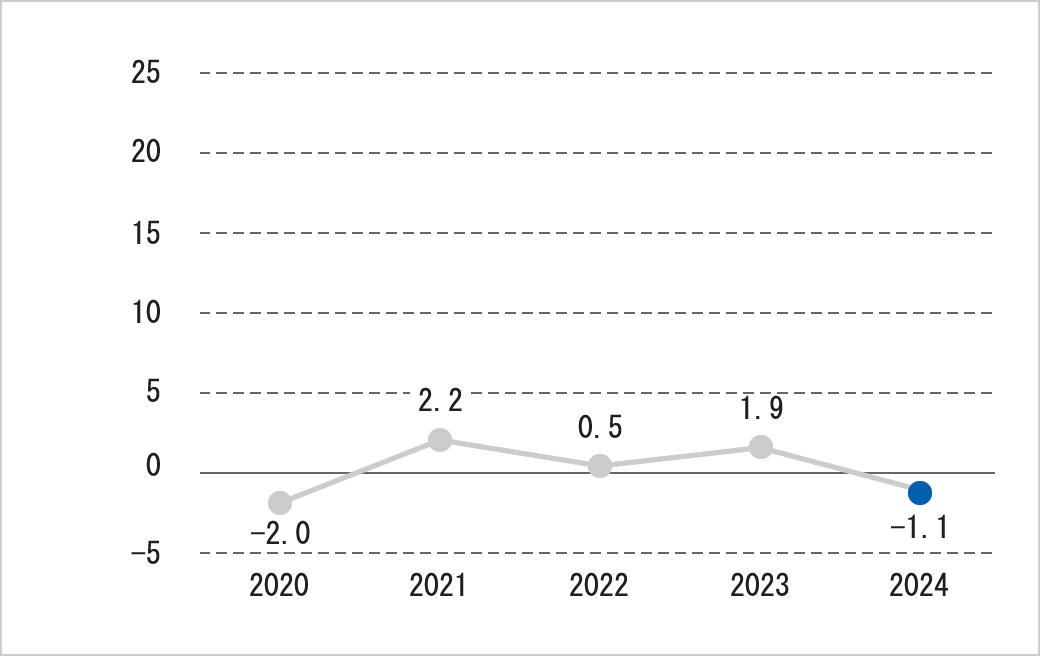
Return on equity
(%)
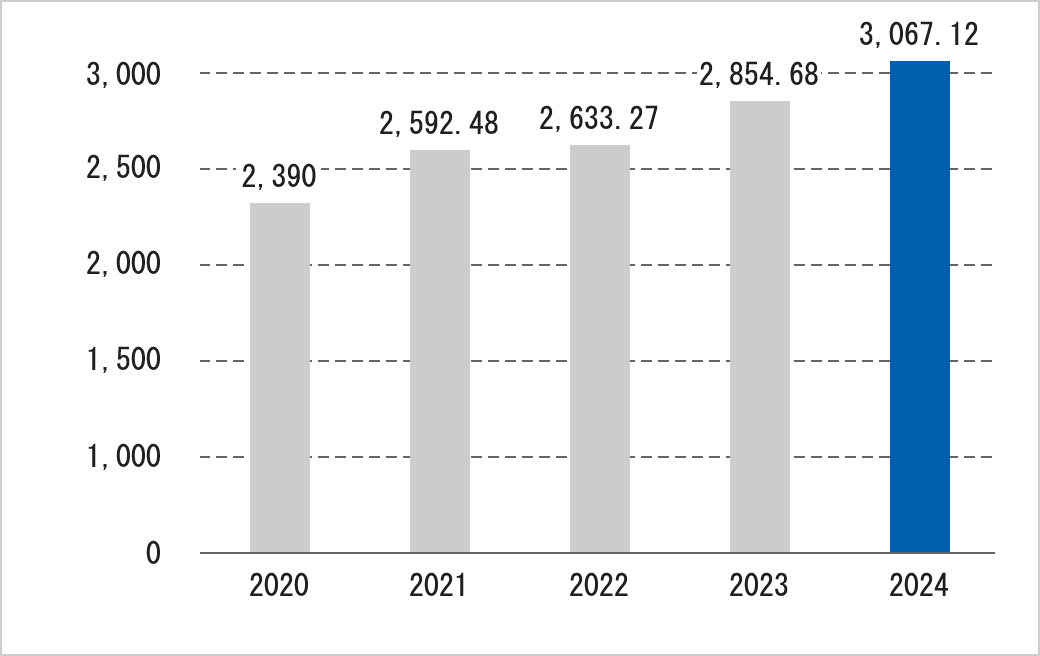
Net assets per share
(yen)
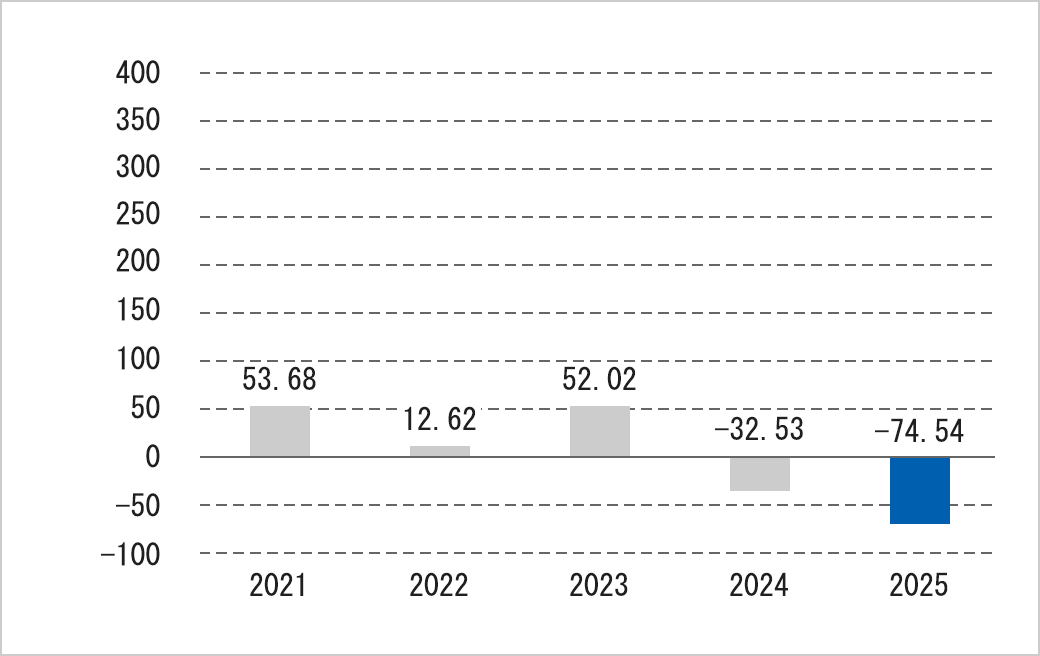
Net income pre share
(yen)
| 2022 Year ending May |
2023 Year ending May |
2024 Year ending May |
2025 Year ending May |
2026 Year ending May |
|
|---|---|---|---|---|---|
| Net sales (million yen) |
340,553 | 370,385 | 353,027 | 359,424 | 357,533 |
| Operating income (million yen) |
3,782 | 2,669 | 3,807 | 1,545 | 1,546 |
| Ordinary income (million yen) |
4,198 | 3,419 | 3,880 | 944 | 882 |
| Current net income (million yen) |
395 | 1,630 | △1,019 | △2,336 | △13,498 |
| Total assets (million yen) |
268,470 | 282,932 | 289,975 | 300,454 | 305,992 |
| Net assets (million yen) |
85,605 | 92,667 | 99,483 | 94,804 | 94,241 |
| Cash flow from sales (million yen) |
2,405 | △171 | 17,196 | 3,216 | 5,404 |
| Cash flow from investments (million yen) |
△7,586 | △7,269 | △8,620 | △14,334 | △6,042 |
| Cash flow from financing (million yen) |
274 | 10,554 | △6,769 | 7,470 | 7,462 |
| Capital adequacy ratio (%) |
30.8 | 31.6 | 33.2 | 30.4 | 29.6 |
| Return on equity (%) |
0.5 | 1.9 | △1.1 | △2.5 | △14.9 |
| Net assets per share (yen) |
2,633.27 | 2,854.68 | 3,067.12 | 2,911.36 | 2,888.11 |
| Net income per share (yen) |
12.62 | 52.02 | △32.53 | △74.54 | △430.74 |
| No. of employees (consolidated) |
10,375 | 10,373 | 10,289 | 10,012 | 9,542 |
- The data presented here are based on the summaries of financial statements.
- If summaries or other financial statements have been amended, the changes will not be reflected in the data presented here.
- Starting with the year ending May 2009, information provided is based on the Accounting Standards for Quarterly Financial Statements (Corporate Accounting Standards, No. 12) and the Implementation Guidance of Accounting Standards for Quarterly Financial Statements (Implementation Guidance of Corporate Accounting Standards, No. 14).